How do I create a Report?
This article will show you how to create your own Report.
If you need a Report other than the nine that have been added automatically to your account you can do so through the Report overview. To begin, select the Reports tab found in the left side menu.

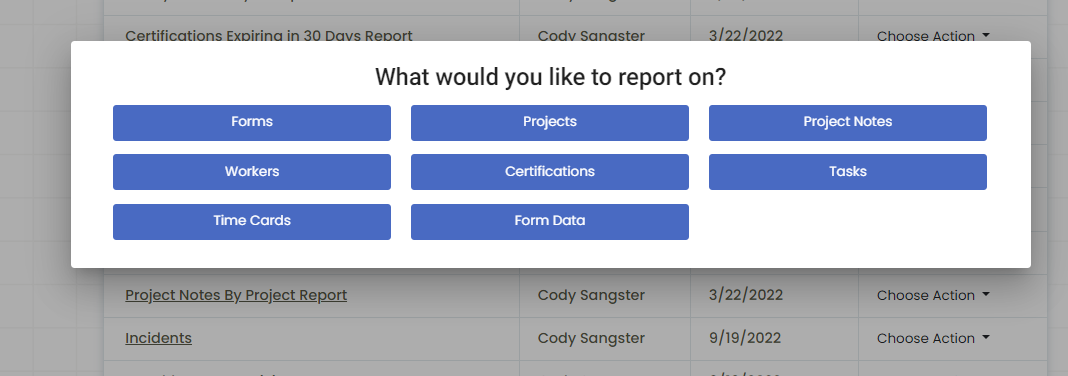
Next, select the "Add" button at the top right of the table and you will be prompted with the below pop-up:

Select what you want to report on.

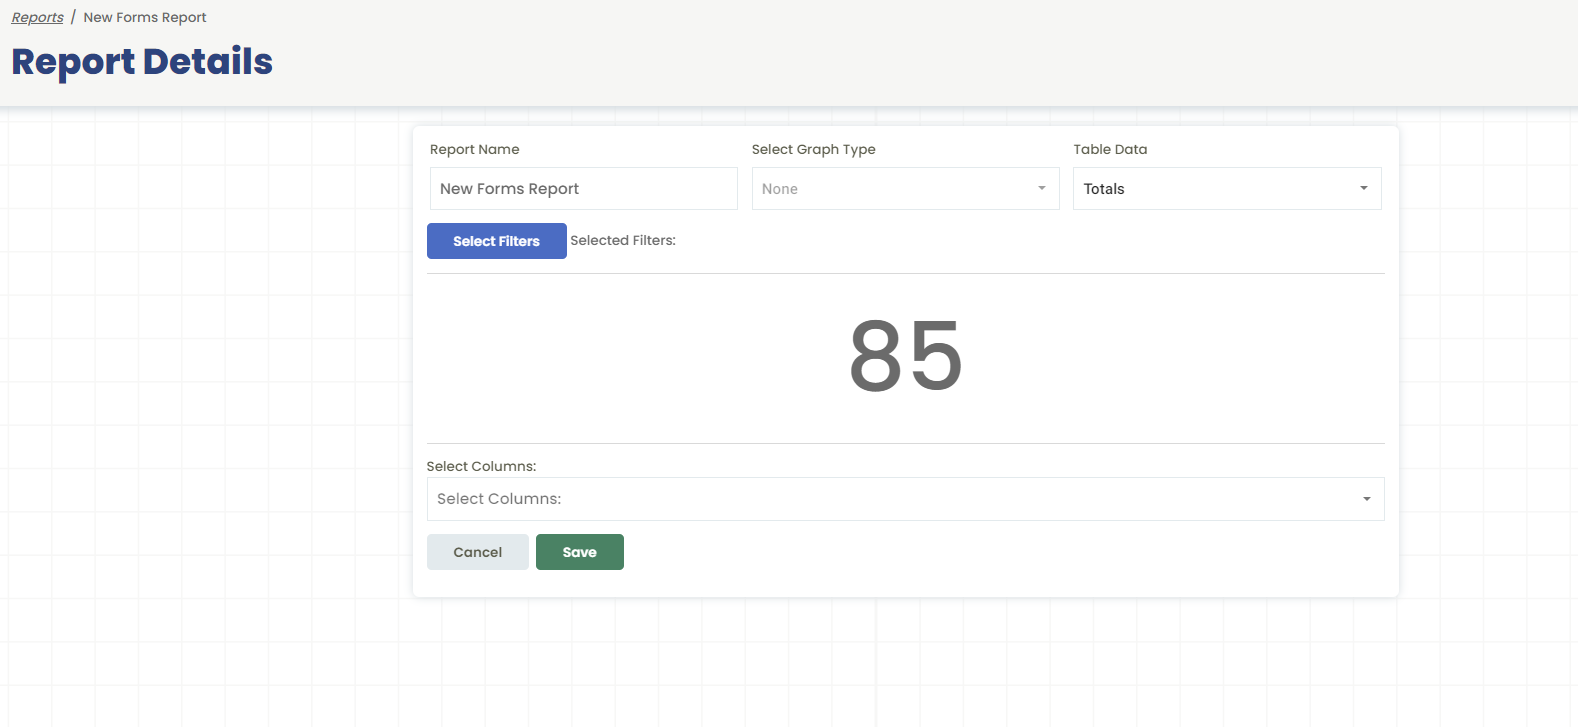
You will then be redirected to this page:

You can then edit how you want the report to look here.
Report Name: You can set the name of the report here.
Select Graph: This allows you to select what your graph will look like. You can select from the current graph types:
- Pie Graph
- Bar Graph
- Line Graph
- None (Will display a number)
Table Data: This allows you to set the secondary data for your report.
When you're ready, click "Save" to keep the report.
.png?width=300&height=77&name=black-logo%20(1).png)